A spot price is not a record
A gold price chart shows the market. It does not show what you own, what you paid, how large gold has become in your portfolio, or what your cash did while you were buying.
Tracker pages · gold investment tracker
Record physical gold by weight and cost, track gold ETFs as positions, and see gold's share of your portfolio next to stocks, bonds, cash, and expenses.
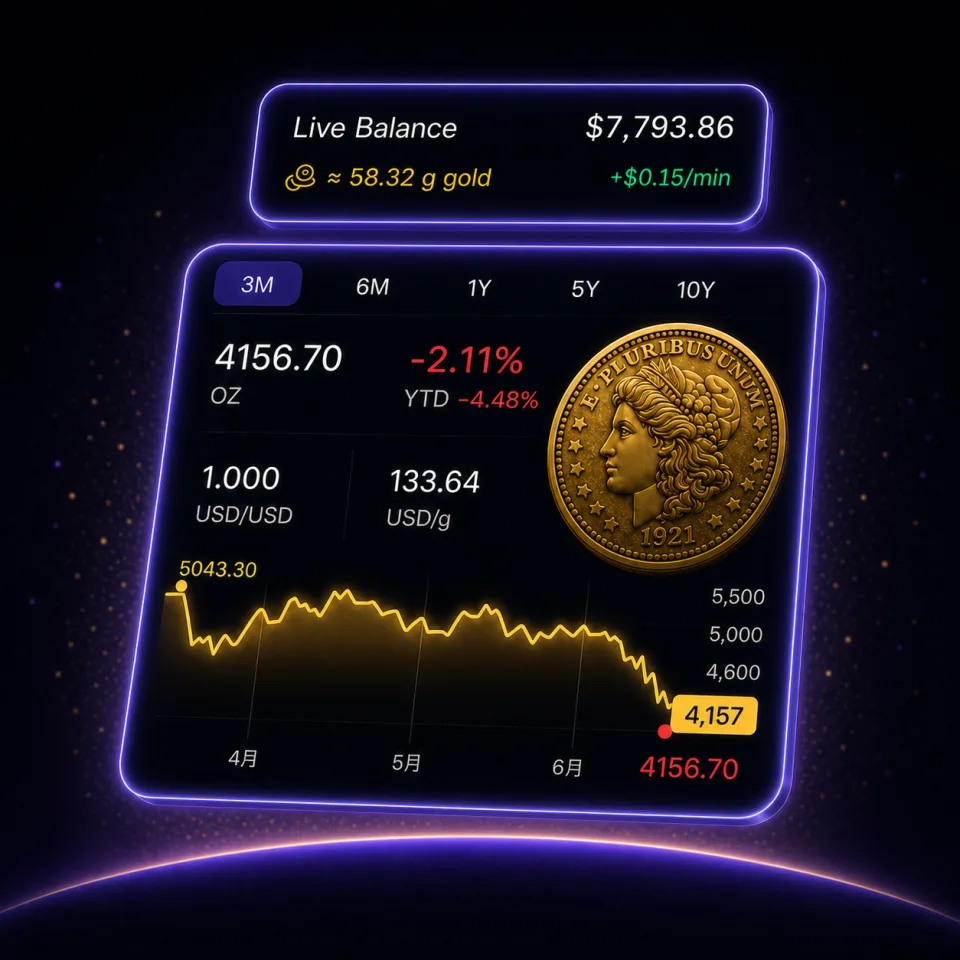
A gold price chart shows the market. It does not show what you own, what you paid, how large gold has become in your portfolio, or what your cash did while you were buying.
In 1cc.ai, physical gold and gold ETFs are positions with a cost basis and a current value. Their share of the portfolio updates with the gold price, and the rest of your records sit next to them. The app does not forecast prices.
Physical gold by weight and cost. Gold ETFs and gold-linked securities as positions. Both grouped under gold in allocation.
Each purchase keeps its entry price. The app flags when gold's share of the portfolio has grown or shrunk.
Gold appears beside expenses, cash balances, stocks, ETFs, US Treasuries, and net worth.
Record physical gold purchases with date, weight, and price.
See gold ETF exposure and bullion in one allocation figure.
Check whether gold's share changed because of price moves or new purchases.
Track stocks, ETFs, options, gold and US Treasuries. Explore stock and option screeners, strategy building and portfolio risk alongside your holdings.
Yes. Physical gold, gold ETFs, and gold-linked positions are recorded in the same portfolio as your other holdings and expenses.
Yes. Physical gold is recorded by weight and cost, gold ETFs as positions. Both count toward the gold allocation.
No. It records and reviews your positions. It does not forecast prices or give investment advice.
A gold purchase is paid from cash. Seeing the purchase, the cash change, and the new allocation in one place shows the whole move.